The Tire Safety Guide
646 people died from tire-related crashes in 2023. Your tires are the only thing connecting your car to the road — and most people don't know when theirs become dangerous.
Based on NHTSA crash data, IIHS research, and forensic tire failure analysis.
🚨 The Numbers: Worn Tires vs. Good Tires
Federal crash data confirms what physics predicts — worn tires dramatically increase your risk.
⚠️ That's a 6.7× higher accident rate. Vehicles with tread depth at or below 2/32" are 3× more likely to experience tire problems in the moments before a crash.
Source: National Motor Vehicle Crash Causation Survey (NMVCCS); Tandy et al. (2013)
📏 How Tread Depth Changes Stopping Distance
On wet pavement, worn tires need dramatically more distance to stop. The "legal minimum" is not the "safe minimum."
Wet Braking at 60 mph
| Tread Depth | Stopping Distance | Extra Distance vs. New | Braking Efficiency |
|---|---|---|---|
| 10/32" (New) | 234 feet | Baseline | 100% |
| 6/32" | 253 feet | +19 feet | 92% |
| 4/32" (Cautious Threshold) | 282 feet | +48 feet | 83% |
| 2/32" (Legal Minimum) | 356 feet | +122 feet | 66% |
Source: Hunter Engineering empirical testing data
💡 The Cautious Driver's Rule: Replace tires at 4/32", not the legal 2/32". That saves 74 feet of stopping distance at 60 mph — about 5 car lengths. That margin is often the difference between a close call and a collision.
Wet Braking at 70 mph
| Tread Depth | Stopping Distance | Extra Distance vs. 4/32" |
|---|---|---|
| 10/32" (New) | ~195 feet | — |
| 4/32" | ~290 feet | Baseline |
| 2/32" (Legal Minimum) | ~379 feet | +89 feet (~6 car lengths) |
Source: TireRack wet pavement testing data
💀 Speed Makes Everything Worse
A tire failure at city speeds is scary. At highway speeds, it's often fatal.
of tire-related crashes happen on expressways
death rate from expressway tire blowouts
fatality rate from tire burst above 75 mph
Why this matters: At highway speed, a single tread element has only about 5 milliseconds of contact time to displace water. Worn tread + high speed = the tire physically lifts off the road (hydroplaning) before you even touch the brakes.
⏰ The 5-Year Rule: Why "Good Tread" Isn't Enough
Tires degrade chemically even if they're never driven on. A tire can look perfect and still be structurally compromised.
What happens inside an aging tire?
Oxygen from the pressurized air inside the tire slowly reacts with the rubber compounds — a process called thermo-oxidative degradation. This is invisible from the outside but causes:
| Physical Property | What Happens | Why It's Dangerous |
|---|---|---|
| Hardness | Increases | Lower grip — rubber can't conform to road |
| Elongation | Decreases | Brittle — can't deform without tearing |
| Peel Adhesion | Decreases | Tread can separate from the belt at highway speed |
This is why experts compare old tires to old rubber bands — they look fine until they snap. Safety experts at NHTSA recommend the 5-year inspection rule and a 10-year absolute maximum, regardless of tread remaining.
📋 How to check your tire's age
Look for the DOT code on the sidewall. The last 4 digits are the week and year of manufacture:
DOT XXXX XXXX 2419
= Week 24 of 2019 → This tire was made in June 2019.
💥 How Tires Fail: Blowouts vs. Tread Separations
Not all tire failures are the same — and one type is far more deadly.
| Failure Mode | Primary Cause | Warning Signs | Crash Risk |
|---|---|---|---|
| Tread Separation | Age / Heat / Design | Belt edge cracking; vibration | High (Rollover/Spinout) |
| Blowout | Underinflation / Impact | Sidewall bulging; scorching | High (Loss of control) |
| Bead Failure | Mounting / Rim issues | Damage to rim-contact area | Moderate (Deflation) |
Rear-tire tread separations are especially dangerous — the vehicle pulls toward the failure side and enters oversteer at lateral acceleration as low as 0.2g, frequently causing spinouts or rollovers. This is why tire aging matters: tread separations are primarily caused by chemical degradation of the belt skim compound, which is invisible from the outside.
❄️ Winter Tires: Where You Need Them
Below 45°F (7°C), standard tire compounds harden and lose up to 50% of their braking power on ice. Here's where dedicated winter or all-weather tires aren't optional — they're a safety requirement.
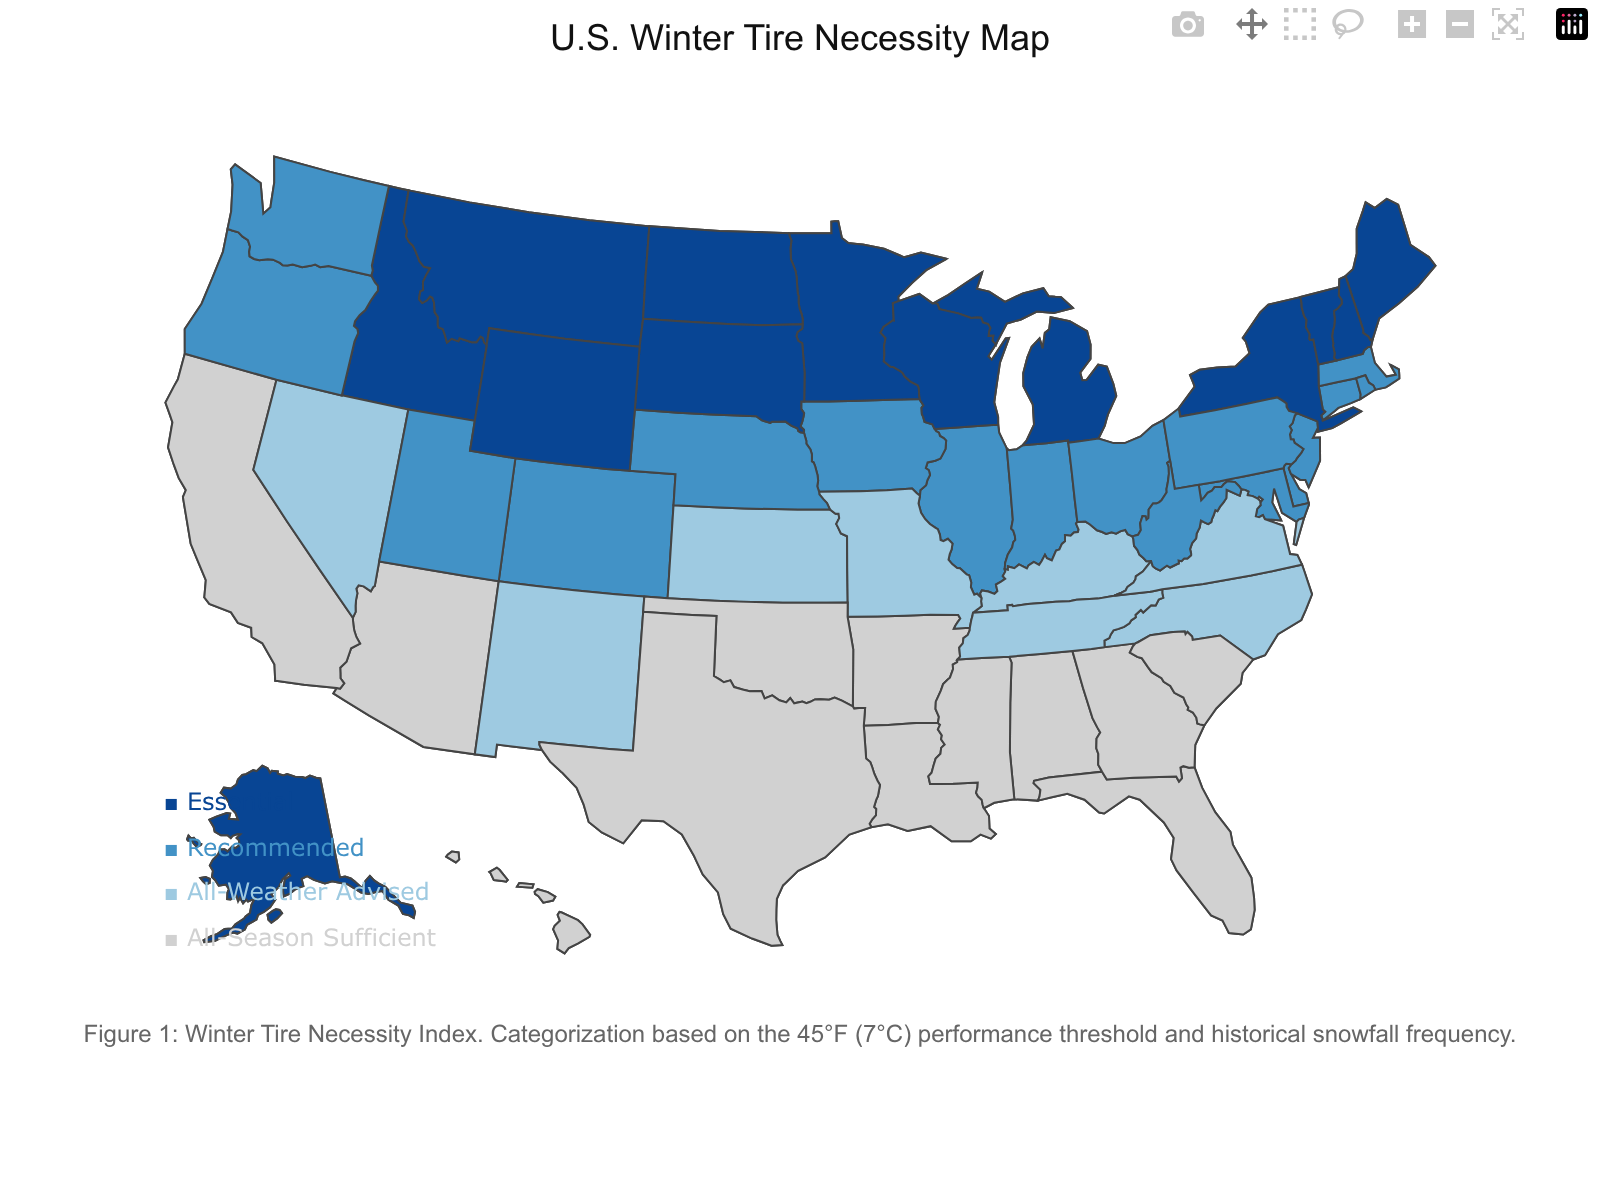
Figure 1: Winter Tire Necessity Index. Based on the 45°F performance threshold and historical snowfall.
| Tire Category | Optimal Temp Range | Winter Capability | Hot Weather Durability |
|---|---|---|---|
| Summer | > 45°F | None (Dangerous in cold) | High |
| All-Season | 45°F – 85°F | Limited (Light snow only) | Moderate |
| All-Weather (3PMSF) | -20°F – 90°F | Certified for snow | Lower (Faster wear) |
| Winter/Snow | < 45°F | Maximum | Poor (Rapid degradation) |
Understanding Winter Tire Symbols
🏔️ 3PMSF (Three-Peak Mountain Snowflake)
Performance-tested: must achieve 10% better snow traction than the reference tire. But — only tests straight-line acceleration on snow. Does NOT test braking, cornering, or ice.
M+S (Mud & Snow)
Pattern-based only: requires 25% tread void. No actual performance testing. An M+S tire may perform poorly in real winter conditions if the rubber compound isn't designed for cold.
New standard: The Ice Grip Symbol (ISO 19447) certifies tires that brake at least 18% better on ice than the reference — look for this if you drive on icy roads regularly.
🔥 The Heat Map: Where Tires Age Fastest
This is the data nobody talks about. Tire aging follows the Arrhenius equation — the reaction speed increases exponentially with temperature. In the Sun Belt, a "5-year-old" tire is structurally equivalent to a much older tire in Minnesota.
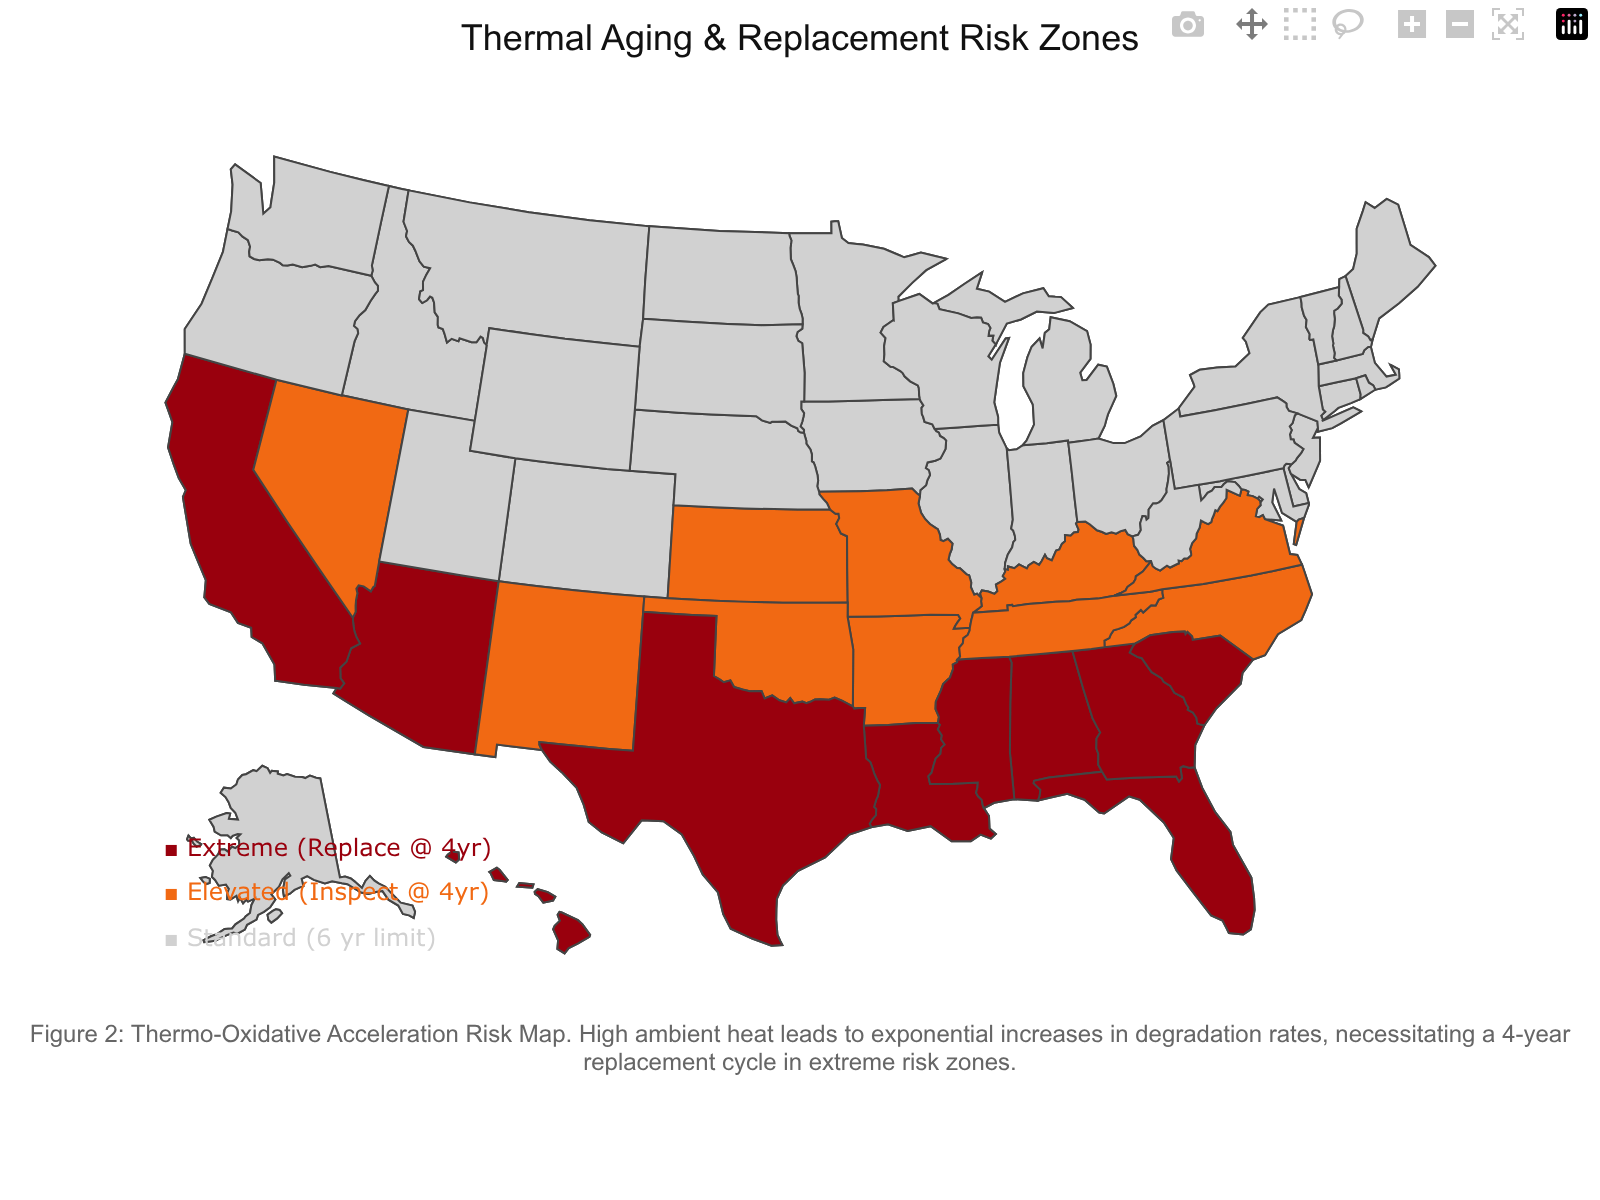
Figure 2: Thermo-Oxidative Acceleration Risk Map. High ambient heat exponentially increases rubber degradation, necessitating a 4-year replacement cycle in extreme risk zones.
Extreme Risk
AZ, FL, TX, LA, MS, AL, GA, SC, HI
Replace every 4 years
Elevated Risk
CA, NV, NM, OK, AR, TN, NC, VA
Inspect at 4 years
Standard
All other states
6-year replacement limit
The 77% Statistic
Between 2002–2006, 77% of all tire-related insurance claims in the United States came from just five states: Texas, California, Louisiana, Florida, and Arizona. Of those claims, 84% involved tires older than 6 years.
Source: NHTSA 2007 Report to Congress on tire aging
Even spare tires aren't safe. Forensic studies show that "unused" spare tires stored in vehicle trunks in hot climates can fail catastrophically if they've been baking for several years. The heat inside a trunk in Phoenix regularly exceeds 150°F — accelerating degradation far beyond what the rubber was designed to withstand.
✅ What to Do Right Now
A 10-minute tire check could save your life. Here's the safety-first protocol:
The Cautious Driver's Checklist
| Check | Standard | Legal Minimum | Our Recommendation |
|---|---|---|---|
| Tread Depth (All-Season) | Replace at 2/32" | 2/32" (penny test) | Replace at 4/32" |
| Tread Depth (Winter) | No standard | 2/32" | Replace at 6/32" |
| Tire Age (Standard) | 10-year max | None | Replace at 5 years |
| Tire Age (Sun Belt) | 10-year max | None | Replace at 4 years |
| Pressure | Monthly check | TPMS warning at -25% | Monthly manual check |
🔧 TPMS Isn't Enough
Your Tire Pressure Monitoring System (required since 2008) only alerts you when pressure drops 25% below the placard value. A tire that's 20% underinflated is already experiencing dangerous internal heat buildup — but your dashboard shows nothing. Direct TPMS is only 55.6% effective at preventing severe underinflation events. Manual monthly checks are still essential.
🏆 Top-Rated Safety Tire Brands (2025)
| Brand | Strength | Key Safety Product |
|---|---|---|
| Michelin | Durability / Innovation | CrossClimate 2 |
| Bridgestone | Winter Performance | Blizzak WS90 |
| Continental | Comfort / Precision | ExtremeContact DWS06 |
| Pirelli | High-Performance | Cinturato WeatherActive |
| Goodyear | Versatility | Assurance WeatherReady 2 |
Safe Tires + Safe Car = Maximum Protection
The safest tires in the world can't save you in a poorly-designed car. See which vehicles have the lowest real-world death rates.
Safest New Cars → Safest Used Cars →📚 Sources & References
- NHTSA TireWise — Tire Safety Ratings and Awareness
- NHTSA Research Report on Tire Aging
- NTSB — Tire Aging and Service Life
- National Motor Vehicle Crash Causation Survey (NMVCCS)
- Tandy et al. (2013) — Tire Tread Depth and Crash Frequency Analysis
- Safety Research & Strategies — NHTSA Tire Fatalities Analysis
- NHTSA 2007 Report to Congress on Tire Aging
- Korea Consumer Agency — Tire Performance and Age Study
- Hunter Engineering — Wet Braking Stopping Distance Research
- Firestone/Ford Tire Failure Forensic Analysis — UC Berkeley