Driving a Death Trap
Measured in Cigarettes
Everyone knows smoking shortens your life. But nobody thinks of their daily commute the same way. We converted IIHS death rates into life-expectancy equivalents.
Every Choice Costs Time
Driving a dangerous vehicle instead of the safest vehicle on the road carries a statistical life-expectancy cost.
Nissan Altima vs. Audi Q7
Cigarettes / Year
≈ 1 cigarette every 2.5 days
Mirage G4 vs. Audi Q7
Cigarettes / Year
≈ roughly 5 per week
The Mortality Chart
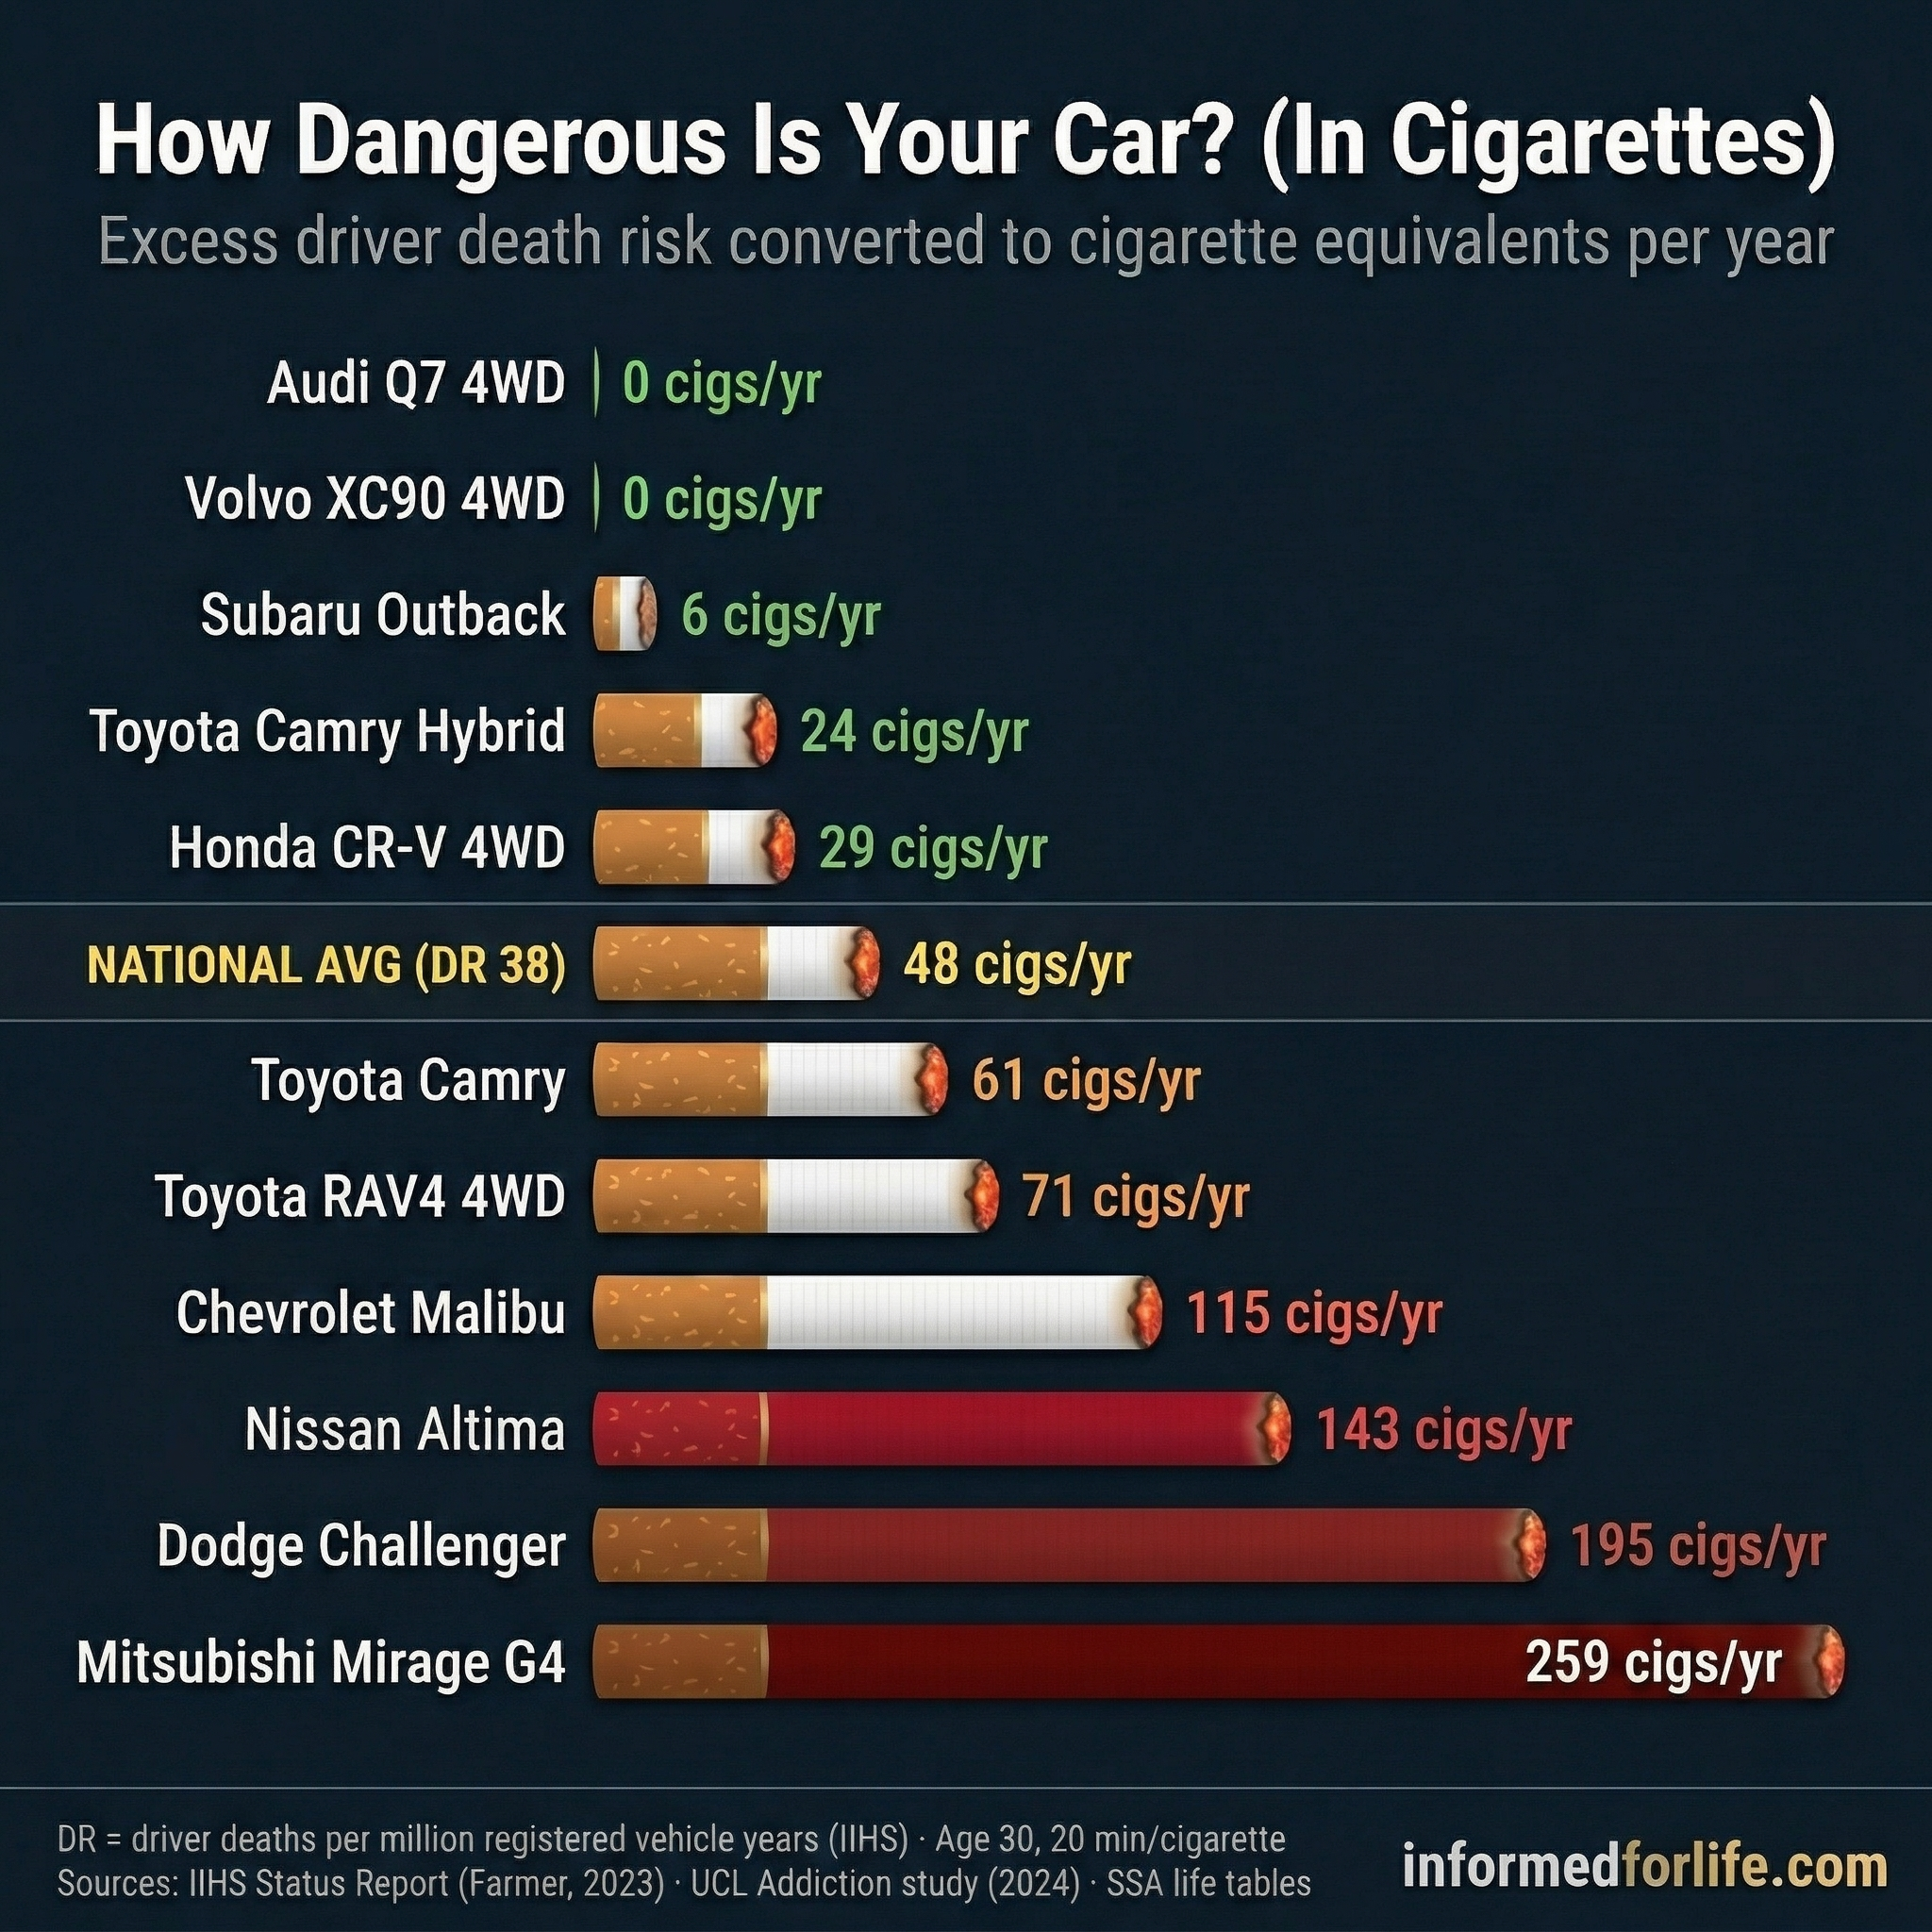
How many extra cigarettes per year you'd need to smoke to equal the baseline risk of driving that car.
The Driver Factor
The Toyota Camry and Camry Hybrid are structurally identical cars. But their death rates differ drastically because of the demographics of the people driving them.
Gas Camry
Deaths per million
≈ 61 cigs/yr
VS
Hybrid Camry
Deaths per million
≈ 24 cigs/yr
Your behavior behind the wheel is the ultimate safety feature. But note: the "Big Altima Energy" effect (DR 113) shows how aggressive driver demographics can triple a car's apparent danger.
The Ultimate Variable: Seatbelts
231
Extra Cigarettes/Year
Not wearing a seatbelt is fundamentally the most dangerous choice you can make inside a vehicle.
Unbelted occupants account for 44% of fatalities despite being only 8% of the public. This adds the equivalent of 231 cigarettes of risk to your life expectancy per year.
Look Up Your Car
Calculation adjusts based on your remaining life expectancy.
View Calculation Methodology
Math: (Vehicle Death Rate - Baseline DR 0) / 1,000,000 = Annual Risk. Annual Risk × Remaining Life = Life Years Lost. Life Years Lost converted to minutes divided by 20 minutes/cigarette (per 2024 UCL Addiction Study) = Cigarettes per Year. Expected values only.